
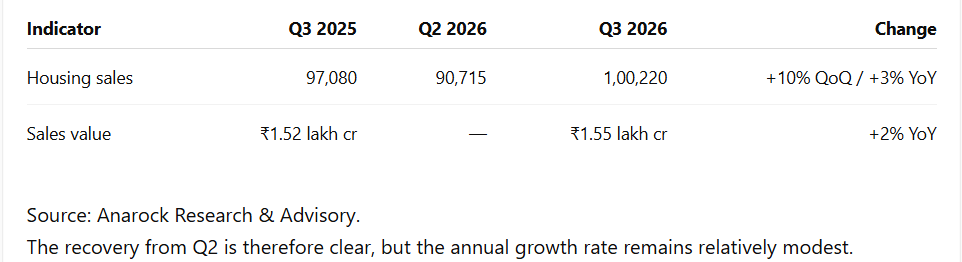
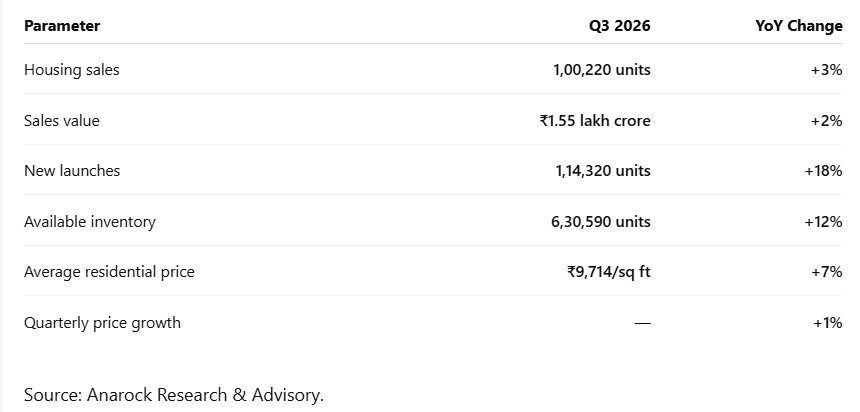
India’s residential real estate market regained momentum in the third quarter of 2026, with housing sales across the top seven cities rising 3% year-on-year to approximately 1,00,220 units.
But the more significant story lies on the supply side.
New housing launches increased by a much sharper 18% year-on-year to approximately 1,14,320 units during Q3 2026. At the same time, available inventory rose 12% to nearly 6.31 lakh units.
The numbers therefore present a market that is growing, but where supply is expanding considerably faster than sales.
The gap between sales and new launches is particularly important for developers and homebuyers. While end-user demand remains resilient, buyers are becoming more selective amid higher property prices and affordability concerns.
According to Anarock Research, the total value of homes sold across the seven markets also increased, rising 2% from approximately ₹1.52 lakh crore in Q3 2025 to ₹1.55 lakh crore in Q3 2026.
Q3 2026 MARKET SNAPSHOT
1,00,220 units — Housing sales
+3% YoY — Sales growth
₹1.55 lakh crore — Approximate sales value
1,14,320 units — New launches
+18% YoY — Growth in new supply
6.31 lakh units — Available inventory
+12% YoY — Inventory growth
+7% YoY — Average residential price growth
Sales Recover, But Growth Remains Measured
Housing sales increased 3% annually in Q3 2026, but the quarterly recovery was more pronounced.
Sales rose 10% from approximately 90,715 units in Q2 2026 to 1,00,220 units in Q3.
This indicates that the residential market regained momentum after a relatively weaker second quarter.
However, the annual increase of just 3% shows that the market is not experiencing a broad-based surge in volumes.
The data instead points towards a market where demand remains present but buyers are increasingly selective.
Anarock Chairman Anuj Puri said resilient end-user demand supported the recovery, while higher prices and affordability concerns continued to keep growth measured.
Sales growth: quarterly versus annual
MMR Remains India’s Largest Housing Market
The Mumbai Metropolitan Region remained the largest contributor to housing sales among the seven cities.
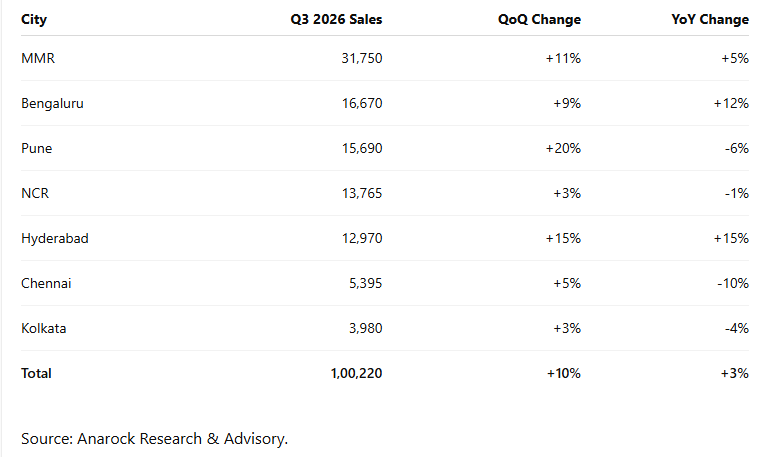
MMR recorded approximately 31,750 units of sales in Q3 2026, representing a 5% annual increase and an 11% quarterly increase.
Bengaluru followed with approximately 16,670 units, up 12% year-on-year.
Together, MMR and Bengaluru accounted for 48% of total housing sales across the seven markets.
Hyderabad was the strongest annual growth market, with sales increasing 15% to approximately 12,970 units.
City-wise housing sales
The city-wise numbers reveal that the national 3% growth is being driven by a relatively narrow group of markets.
MMR, Bengaluru and Hyderabad all recorded annual growth, while Pune, NCR, Chennai and Kolkata saw year-on-year declines.
This is important because it shows that India’s residential market is not moving uniformly.
Hyderabad Emerges as the Fastest-Growing Sales Market
Hyderabad stands out on the demand side.
Housing sales increased 15% both quarterly and annually, reaching approximately 12,970 units.
This makes Hyderabad the only market alongside Bengaluru and MMR to record a substantial annual increase in sales among the seven cities.
More importantly, Hyderabad is also witnessing a massive expansion in new supply.
The city launched approximately 18,950 units in Q3 2026, compared with 8,630 units in Q3 2025 — a 120% annual increase.
That creates an interesting demand-supply equation.
HYDERABAD: DEMAND VS SUPPLY
Housing sales: +15% YoY
New launches: +120% YoY
The increase in supply is therefore dramatically larger than the increase in sales.
This does not necessarily indicate immediate stress in the market, but it does mean Hyderabad’s inventory trajectory will be important to monitor as new projects enter the market.
MMR Leads Both Sales and New Supply
MMR occupies an unusual position in the Q3 data.
It was the largest market for sales, at 31,750 units, but it was also the largest market for new launches, at approximately 37,500 units.
New supply increased 27% year-on-year and 9% quarter-on-quarter.
More than 51% of MMR’s new supply was in the below-₹80 lakh segment.
This is significant because MMR is generally associated with high residential prices, yet more than half of the quarter’s new supply was below ₹80 lakh.
That suggests developers are continuing to introduce a significant volume of relatively lower-ticket housing within the region.
Bengaluru Continues to Show Strong Demand
Bengaluru recorded approximately 16,670 housing sales during Q3, up 12% annually.
New supply also increased, rising 17% year-on-year to approximately 17,720 units.
Approximately 81% of Bengaluru’s new supply fell within the ₹80 lakh to ₹2.5 crore price range.
The city therefore continues to show a relatively strong balance between demand and new project additions, although the supply increase remains larger than its sales growth in percentage terms.
Pune’s Quarterly Recovery Hides an Annual Decline
Pune presents another interesting case.
Sales rose 20% quarter-on-quarter to 15,690 units, the strongest quarterly increase among the seven markets.
However, sales remained 6% below Q3 2025.
New launches followed a similar pattern: supply increased 47% from Q2 but was still 3% below the level recorded a year earlier.
Pune therefore illustrates why looking only at quarterly numbers can give an incomplete picture.
The city experienced a strong sequential recovery, but its annual numbers remain weaker.
New Launches Outpace Sales
The biggest analytical takeaway from the Q3 data is the widening gap between new supply and sales.
Approximately 1,14,320 homes were launched, compared with 1,00,220 homes sold during the quarter.
That means new launches exceeded sales by roughly 14,100 units.
The supply-demand equation
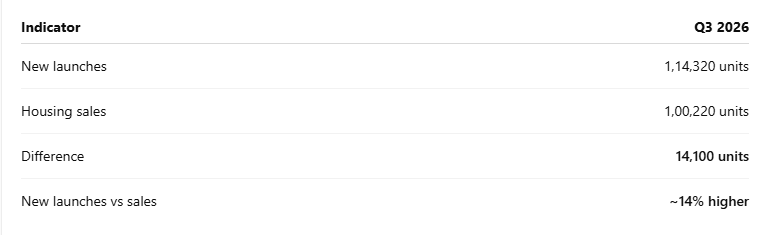
This does not mean all 14,100 additional units became unsold inventory during the quarter, because the inventory position also depends on existing stock, project completion schedules and other market dynamics.
However, it does indicate that developers are bringing homes to market at a faster pace than the rate at which homes are being absorbed.
That makes the quality and location of new launches increasingly important.
The ₹80 Lakh–₹1.5 Crore Segment Dominates New Supply
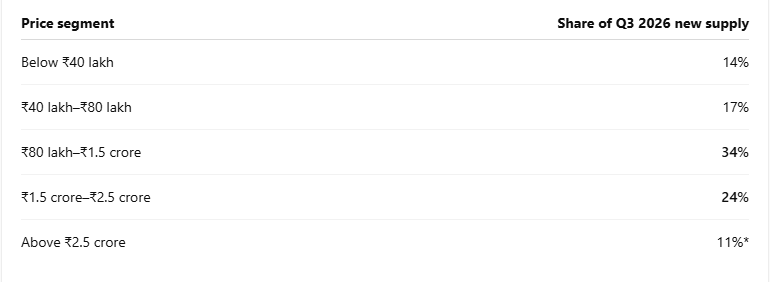
The largest share of new supply during Q3 came from homes priced between ₹80 lakh and ₹1.5 crore.
This segment accounted for 34% of new launches.
The ₹1.5 crore–₹2.5 crore segment accounted for another 24%.
Together, these two categories represented 58% of new supply.
The most striking number is the relatively small share of affordable housing.
Homes below ₹40 lakh accounted for only 14% of new supply.
AFFORDABILITY WATCH
The largest supply segment is now ₹80 lakh–₹1.5 crore, while homes below ₹40 lakh account for only 14% of new launches.
This creates an important question for the residential market: Is new supply being aligned with the affordability levels of the largest pool of potential homebuyers?
The source itself notes that buyers are likely to remain selective because of higher prices and increasing affordability concerns.
Inventory Rises 12%
Available housing inventory across the seven cities increased 12% year-on-year.
Inventory rose from approximately 5,61,760 units at the end of Q3 2025 to approximately 6,30,590 units at the end of Q3 2026.
Inventory was approximately 6,16,500 units at the end of Q2 2026.
Inventory movement
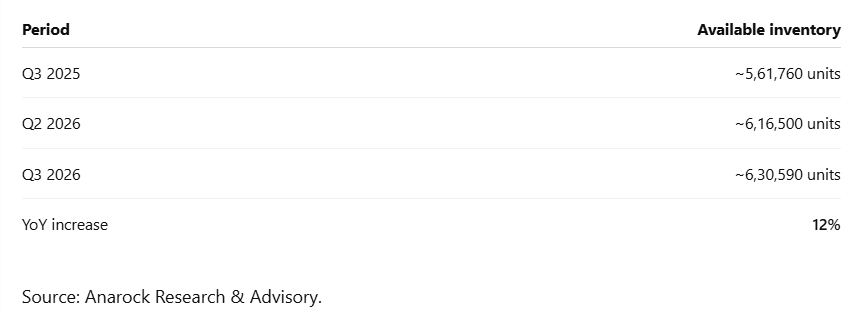
This is an important metric for the market because inventory is rising faster than sales.
For developers, this makes project-level sales velocity increasingly important.
For buyers, however, higher inventory can mean more choice and potentially greater negotiating power, particularly in markets or projects where absorption is slower.
Prices Rise 7%, But Quarterly Growth Is Only 1%
Average residential prices across the seven cities rose 7% year-on-year in Q3 2026.
The average price increased from approximately ₹9,105 per sq ft in Q3 2025 to ₹9,714 per sq ft in Q3 2026.
However, the quarterly increase was only 1%. NCR recorded the highest annual price growth at 12%, followed by Bengaluru at 8%.
The relatively modest 1% quarterly increase suggests that the pace of price appreciation has moderated in the short term, even though annual prices remain significantly higher.
Sales Value Rises Only 2% Despite 3% Volume Growth
Another interesting signal comes from the relationship between sales volumes and total sales value.
Housing sales increased 3% year-on-year, but the total value of sales rose only 2%.
This indicates that the increase in transaction volumes has not been accompanied by an equivalent increase in aggregate sales value.
The data does not provide enough information to attribute this difference to a specific change in ticket sizes, but it reinforces the broader picture of a market where volume growth remains measured.
The Market Is Becoming More Selective
Anarock’s assessment is that the upcoming festive season could support residential demand, helped by festive sentiment, stable borrowing costs and a healthy new-launch pipeline.
However, the research firm also expects buyers to remain selective because of higher prices and affordability concerns.
Anarock Chairman Anuj Puri said:
“Demand is resilient, but we expect more measured growth – well-priced, well-located projects that align with the current demand profile will outperform others this festive season.”
This is perhaps the most important interpretation of the Q3 numbers.
The market is not showing a collapse in demand. But neither is it showing a broad-based volume boom.
Instead, demand appears to be increasingly concentrated around projects that fit buyers’ expectations on price, location and product.
What the Q3 Numbers Mean for Developers
For developers, the data presents both an opportunity and a warning.
The opportunity is clear: more than one lakh homes were sold in the quarter, and the market recovered strongly from Q2.
The warning is that new supply is growing much faster than sales.
With inventory also up 12%, developers may need to pay greater attention to sales velocity rather than simply launching additional inventory.
The strongest-performing markets may continue to support new supply, but the price positioning of projects becomes increasingly important as buyers become more selective.
What the Numbers Mean for Homebuyers
For homebuyers, the Q3 data provides a somewhat different picture.
There is substantially more new supply entering the market, and overall inventory has increased.
That means buyers have more options across several major cities.
However, average prices remain 7% higher than a year earlier, and the largest supply segment is concentrated between ₹80 lakh and ₹1.5 crore.
Therefore, greater choice does not necessarily mean cheaper homes.
The key issue for buyers is increasingly likely to be the relationship between price, location, project quality and affordability.
Seven-City Residential Market: The Numbers at a Glance
The Bottom Line
The Q3 2026 residential market data presents a picture of recovery, but not runaway growth.
Sales have returned to the one-lakh-unit quarterly level across the top seven cities, increasing 3% year-on-year and 10% sequentially.
But developers have been considerably more aggressive on supply, with new launches rising 18% annually.
That imbalance has contributed to a 12% increase in available inventory.
At the same time, average prices are still moving upward, rising 7% annually, although quarterly price growth has slowed to 1%.
The regional picture is equally important.
MMR remains the country’s largest residential market by both sales and new supply. Bengaluru continues to record strong demand. Hyderabad is showing the strongest annual growth in sales, but its 120% increase in new supply makes inventory trends particularly important. Pune has recovered sharply quarter-on-quarter but remains below its year-ago sales level.
The overall market therefore appears to be entering a phase where the quality of demand may matter more than the quantity of launches.
With the festive season approaching, the next quarter will show whether the current recovery can translate into stronger annual growth — or whether rising inventory and affordability concerns keep the market’s expansion measured.
Also Read: MMR clocks residential sales of Rs 39,170 Crores in Oct-Dec Quarter