Q1FY23 witnessed the highest ever quarterly launches of 95,550 units in Tier 1 cities in India. MMR alone contributed 32,800 units, followed by Hyderabad (17,130), Pune (14,615), and Ahmedabad (12,669).

By Varun Singh

Q1FY23 (June 22) witnessed the highest ever quarterly launches of 95,550 units in Tier 1 cities in India. MMR alone contributed 32,800 units, followed by Hyderabad (17,130), Pune (14,615), and Ahmedabad (12,669).

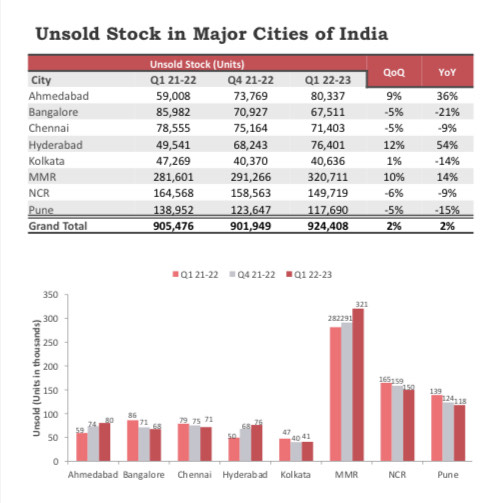
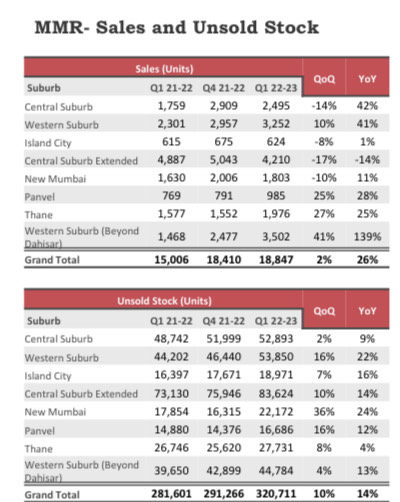
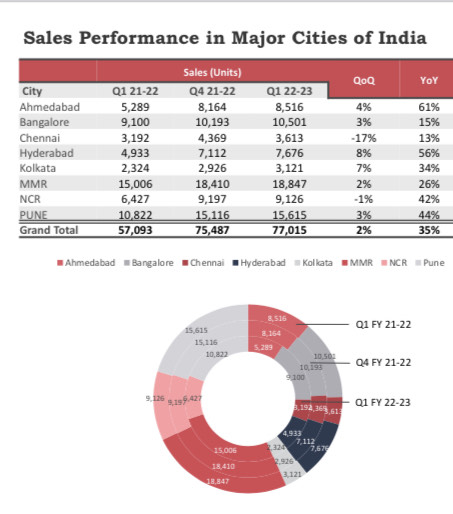
According to Liases Foras a real estate research firm, Sales grew 2% in the June quarter (Q1 FY 22-23). 77,015 units were sold during the quarter in Tier 1 cities. MMR clocked the maximum sales of 18,847 units, followed by Pune, 15,615 units, and Bengaluru, 10,505 units, respectively. Unsold increased 2% on QoQ basis, and the current unsold across the top 8 cities stands at 924,408 units. It decreased ~5% in
Bangalore, Chennai, NCR, and Pune on QoQ.

Unsold in MMR reached 320,711 units, an increase of 10% on a QoQ basis. The average month’s inventory of all projects in Tier 1 cities stands at 36 months, the best since 2014.
With 19 months of inventory, Bengaluru reaches to an efficient level of months inventory of below 20 months.

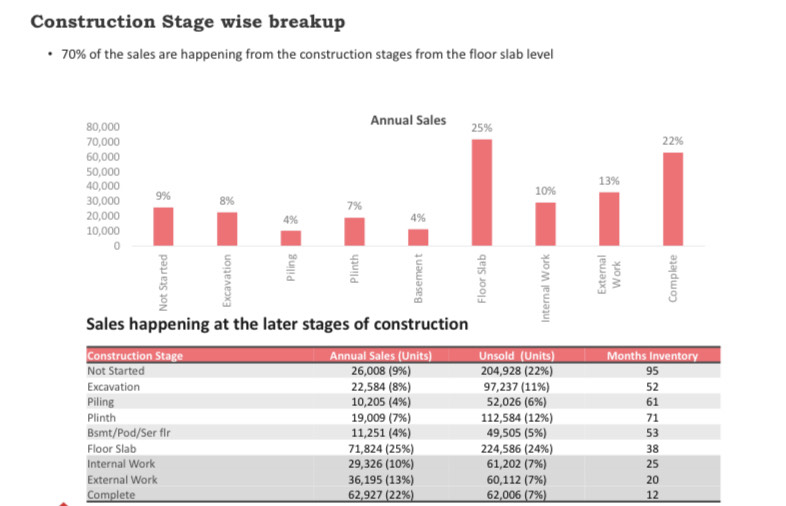
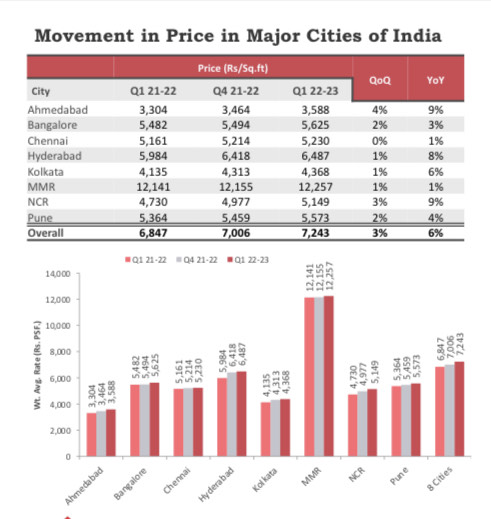
Completed projects have the least months inventory of 12 months in Tier 1 cities, while the under-construction projects have 45 months of inventory. The average price in tier I cities increased 3% on QoQ and 6% on a YoY basis. 58% of projects showed price appreciation of 0 to 5%, and 22% of projects showed more than 5% appreciation. 20% of the projects had seen a price decline up to 10% on a YoY basis. H1 2022 is now the best performing half year in sales numbers since 2009.

Q1 FY 22-23 residential market report of the top 8 cities in India

Also Read: Amidst disruptions, residential housing prices rose by 4%

You May Also Like

BFSI and Flex Spaces Drive Office Space Demand in Q3 2024

The office space market in India saw a significant shift in Q3 2024, with BFSI and Flex Spaces driving a 20% increase in demand. Bengaluru and Hyderabad led absorption, while cities like Mumbai and Chennai experienced declines.

Lead-to-Buy Conversion Time for Indian Housing Drops to 26 Days in H1 FY25, Reflecting Strong Demand

The latest ANAROCK data reveals a significant drop in the lead-to-buy conversion time for Indian homes, now standing at just 26 days in H1 FY25, down from 33 days in FY21. Ultra-luxury homes, priced above INR 3 Cr, are seeing the quickest decisions, while mid-range homes continue to see slightly longer conversion times due to rising property prices. The trend reflects both strong demand and growing buyer confidence in reputable developers.

Housing prices increased 10% YoY in Q1 2024

Bengaluru and Delhi NCR witnessed steep price movements at 19% and 16%…

Group deal of 35 flats for Rs 200 crore in Parel?

Real estate market is abuzz with a group realty deal of 35…