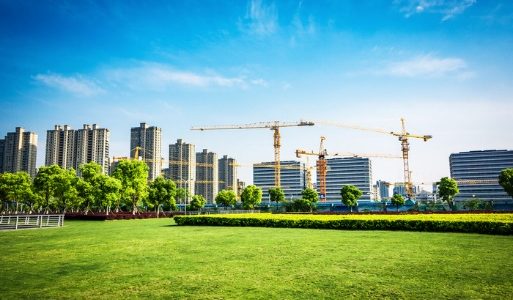

Mumbai’s housing landscape is set for a major transformation as society redevelopment projects across the city are expected to add 44,277 new homes by 2030, with an estimated market value of ₹1.3 trillion (₹1,305 bn). According to a report by a leading real estate research firm, redevelopment will not only reshape the city’s skyline but also provide a significant boost to government revenues.
Suburbs Lead the Transformation
The suburban corridors are dominating the redevelopment wave. Since 2020, 910 housing societies have signed development agreements, unlocking 326.8 acres (1.32 million sq m) of potential land area.
Out of these, Western Suburbs accounted for 633 societies (70%), followed by the Central Suburbs with 234 societies, pushing the suburban contribution to nearly 96% of total agreements.
Estimated Future Supply of New Homes
| Micro Markets | Estimated Units | Market Value (₹ bn) |
|---|---|---|
| Western Suburbs | 32,354 | 941 |
| Central Suburbs | 10,422 | 243 |
| Central Mumbai | 1,085 | 91 |
| South Mumbai | 416 | 30 |
| Total | 44,277 | 1,305 |
Note: Supply-side estimates; do not factor in launch velocity, financing, or phasing.
The Western Suburbs, spanning Bandra to Borivali, will absorb the bulk of activity with 73% of total new housing supply, while South Mumbai will see only 416 new units.
Government Revenue Potential
The state exchequer is set to benefit substantially from this wave of redevelopment. Over the next five years, the government is projected to earn:
- ₹6,500 crore from the sale of free-sale components
- ₹7,830 crore from stamp duty
- ₹6,525 crore from GST collections
Small Plots Dominate, Larger Deals Emerging
Redevelopment activity remains largely concentrated in small plots. Over 80% of societies that signed deals since 2020 had a plot size of less than 0.49 acres.
Redevelopment Deals by Plot Size (2020–2025)
| Area Range (Acres) | 2020 | 2021 | 2022 | 2023 | 2024 | 2025 | Total Deals |
|---|---|---|---|---|---|---|---|
| 0 – 0.25 | 49 | 166 | 134 | 36 | 86 | 59 | 530 |
| 0.25 – 0.49 | 12 | 69 | 47 | 17 | 51 | 28 | 224 |
| 0.49 – 0.74 | 5 | 19 | 14 | 8 | 25 | 10 | 81 |
| 0.74 – 0.99 | 2 | 4 | 3 | 0 | 12 | 8 | 29 |
| 0.99 – 1.24 | 1 | 2 | 0 | 2 | 5 | 2 | 12 |
| 1.24 – 1.48 | 0 | 2 | 2 | 0 | 4 | 2 | 10 |
| 1.48 – 2.47 | 0 | 1 | 0 | 2 | 8 | 4 | 15 |
| More than 2.47 | 0 | 0 | 0 | 2 | 5 | 2 | 9 |
| Grand Total | 69 | 263 | 200 | 67 | 196 | 115 | 910 |
Despite the dominance of small societies, the average deal size has been growing steadily, signalling the rise of larger clusters and better land aggregation efforts.
Long Timelines and Risks
Redevelopment remains a long-cycle process, typically stretching 8–11 years from ideation to handover. Projects face risks from changing market cycles, regulatory hurdles, and financing challenges.
Typical Redevelopment Timeline
| Stage | Process Details | Duration |
|---|---|---|
| Consent & Planning | Society decision-making, approvals | ~2 years |
| Developer Selection | PMC appointment, feasibility, bids, DA | ~2 years |
| Pre-Construction | IOD, permissions, vacation, demolition | 1 – 1.5 years |
| Construction & Handover | Building, possession transfer | 3 – 5 years |
Market Outlook
Experts caution that redevelopment economics must balance developer sustainability and society expectations. In markets priced below ₹40,000 per sq. ft., developers should share no more than 30–35% of the area with societies. This share may rise to 35–40% in mid-priced zones, and up to 50% in premium locations above ₹75,000 per sq. ft.
Without financial discipline, projects risk stalling, leaving both developers and homeowners exposed.
The Road Ahead
With 910 societies already in motion and a pipeline of over 44,000 new homes, Mumbai’s redevelopment push is poised to define the city’s next housing cycle. The success of this transformation will depend on policy support, sound financial structuring, and timely consensus among stakeholders.
Also Read: Sonu Sood Sells Mahalaxmi Apartment for ₹8.10 Crore