
India’s Grade A office market remained resilient through the first nine months of 2026, with gross leasing across the country’s top seven office markets reaching 54.4 million sq ft, a 7% year-on-year increase over the 50.9 million sq ft recorded during the corresponding period of 2025.
The momentum strengthened in the third quarter. Grade A gross absorption reached 18.7 million sq ft in Q3 2026, rising 7% sequentially from 17.4 million sq ft in Q2 and 9% annually from 17.2 million sq ft in Q3 2025.
The numbers point to an office market that is not merely maintaining its pace but is seeing a shift in the composition of demand. Conventional office leasing has remained broadly stable, while flex-space operators have emerged as one of the fastest-growing sources of occupancy.
At the same time, developers have responded to the improving demand environment with a sharp increase in new supply. More than 19 million sq ft of Grade A office space was added during Q3 alone, taking nine-month supply to 41.7 million sq ft.
The result is a market where demand is strong, but supply is also accelerating.
KEY MARKET SNAPSHOT
54.4 MSF — Grade A gross leasing during Jan-Sep 2026
+7% YoY — Growth in nine-month leasing
18.7 MSF — Q3 2026 leasing
+7% QoQ / +9% YoY — Q3 leasing growth
41.7 MSF — New supply during Jan-Sep 2026
12.6 MSF — Flex-space leasing during Jan-Sep 2026
16% — Overall vacancy at the end of Q3 2026
+7% YoY — Average rentals across the top seven markets
Q3 Changes the Tone of the 2026 Office Market
The most important number in the Colliers data is arguably not the 54.4 million sq ft cumulative figure but the acceleration seen in Q3.
After a relatively cautious second quarter, leasing rose to 18.7 million sq ft in Q3. This was the highest third-quarter absorption recorded in recent years, according to Colliers.
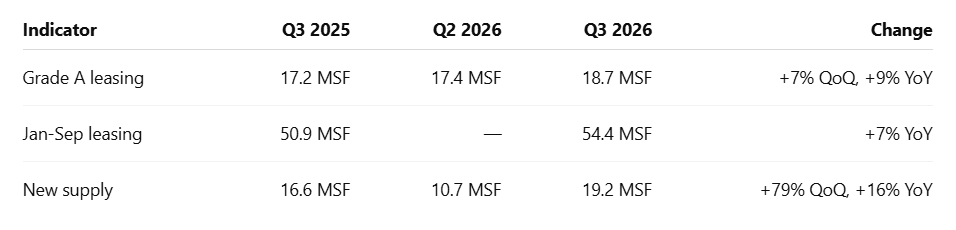
This matters because Q2 had raised questions about whether external volatility could materially slow occupier expansion. The Q3 rebound suggests that companies continued to take office space despite the uncertain global economic environment.
Colliers Managing Director, Office Services, Arpit Mehrotra said the market could potentially see 75-80 million sq ft of transactions across the major office markets in 2026, provided the strong demand trajectory continues in the final quarter.
That is a projection rather than an achieved result, but it provides an indication of how the research firm views the current demand pipeline.
Bengaluru Remains the Largest Leasing Engine
Bengaluru continued to dominate India’s Grade A office market.
The city recorded 15.7 million sq ft of leasing during Jan-Sep 2026, accounting for approximately 29% of total leasing across the seven markets.
Hyderabad was the standout growth market, however. Its nine-month absorption reached 9.4 million sq ft, representing a 47% year-on-year increase.
Delhi NCR also recorded strong growth, while Pune remained positive on a nine-month basis.
City-wise office demand
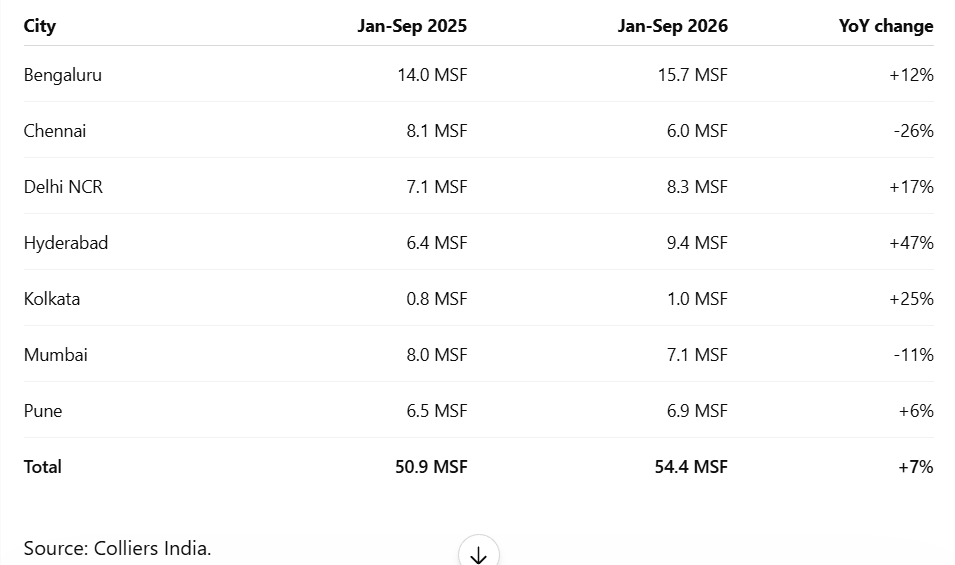
The city numbers reveal an important feature of the market: the 7% national growth is not evenly distributed.
Bengaluru and Hyderabad together accounted for 25.1 million sq ft of the 54.4 million sq ft leased during the first nine months — nearly half of the total.
Hyderabad’s 47% growth is particularly significant because it indicates that the expansion is not limited to the country’s traditional office-market leader.
Mumbai and Chennai Move Against the National Trend
Mumbai recorded 7.1 million sq ft of leasing during Jan-Sep 2026, down 11% from 8 million sq ft in the corresponding period of 2025.
Chennai saw a sharper decline, with leasing falling 26% from 8.1 million sq ft to 6 million sq ft.
This creates an important distinction between national growth and individual-market performance.
The overall Indian office market is expanding, but the expansion is being driven by a combination of stronger performance in Bengaluru, Hyderabad and Delhi NCR, along with growth in Pune and Kolkata.
For Mumbai, the data therefore points to a more measured leasing environment compared with the national market during the first nine months of 2026.
The Bigger Structural Change: Flex Space
Perhaps the most consequential trend in the report is the growth of flex-space leasing.
Flex operators leased 12.6 million sq ft during Jan-Sep 2026, up 37% from 9.2 million sq ft during the same period in 2025.
Their share of total leasing increased from 18% to 23%.
Flex versus conventional office leasing
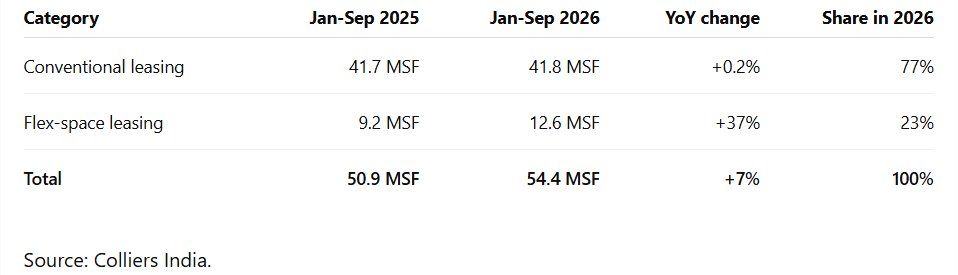
The contrast is striking.
Conventional leasing was essentially flat, increasing from 41.7 million sq ft to 41.8 million sq ft. Almost the entire year-on-year increase in overall leasing therefore came from flex-space activity.
In other words, the headline 7% growth in office leasing masks a much more substantial change in the nature of occupier demand.
ANALYTICAL BOX: WHAT IS DRIVING THE GROWTH?
Total leasing increased by 3.5 million sq ft between Jan-Sep 2025 and Jan-Sep 2026.
Conventional leasing increased by only 0.1 million sq ft.
Flex-space leasing increased by 3.4 million sq ft.
This means the increase in total leasing was overwhelmingly associated with the expansion of flex-space activity.
Colliers reported that Bengaluru and Delhi NCR were the leading flex markets, with each recording 2.8 million sq ft of flex-space leasing during the nine-month period. Delhi NCR and Hyderabad recorded more than a two-fold increase in flex-space uptake.
Technology Remains the Core Conventional Occupier
While flex-space operators are expanding rapidly, technology companies remain the largest conventional occupiers.
Technology companies accounted for close to 16 million sq ft of conventional leasing during Jan-Sep 2026.
BFSI and engineering and manufacturing followed.
Together, technology, BFSI, and engineering and manufacturing accounted for nearly three-fourths of conventional office demand during the period.
Bengaluru and Hyderabad together accounted for more than 55% of conventional technology-sector office demand, reinforcing their importance as technology-driven office markets.
Mumbai, meanwhile, remained the leading market for BFSI leasing, accounting for 30% of conventional BFSI space uptake during the nine-month period.
This creates two distinct demand engines:
Technology-led conventional demand remains concentrated in Bengaluru and Hyderabad, while flex-space growth is spreading across multiple markets.
Developers Respond With a Sharp Supply Increase
The supply side of the market is equally important.
Developers added 41.7 million sq ft of new Grade A office space across the seven markets during Jan-Sep 2026, only 1% higher than the 41.4 million sq ft added in the corresponding period of 2025.
But the quarterly picture was dramatically different.
Q3 alone saw 19.2 million sq ft of new supply, compared with 10.7 million sq ft in Q2 — an increase of 79%.
New office supply
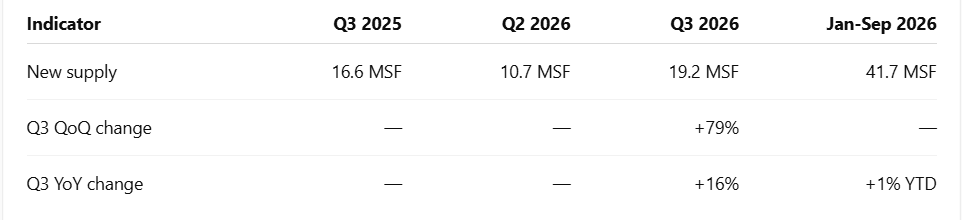
Hyderabad led the quarterly supply addition with 6.7 million sq ft, representing 35% of Q3 additions.
Bengaluru contributed another 28%.
On a nine-month basis, Bengaluru added 14.1 million sq ft, accounting for approximately one-third of total completions across the seven markets.
Supply Is Not Moving Uniformly Across Cities
The nine-month supply figures also reveal divergent development patterns.
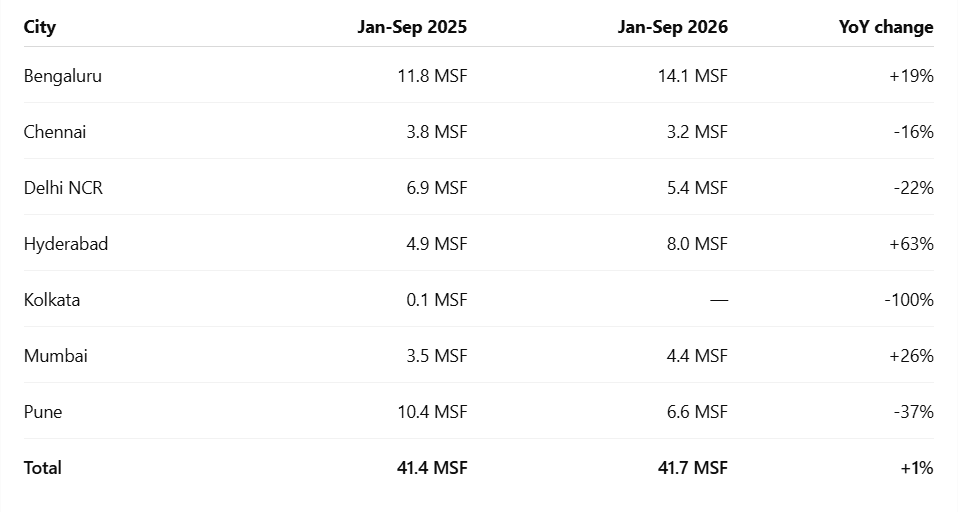
The data shows that Hyderabad is simultaneously experiencing strong demand and a significant increase in supply.
Bengaluru is in a similar position, although the increase in supply is smaller relative to its demand base.
Mumbai’s supply increased 26% year-on-year even as its leasing declined 11%. That divergence is worth watching because it could influence vacancy and rental dynamics within individual micro-markets.
Vacancy Rises Despite Strong Demand
The office market’s resilience does not mean that all supply-side pressure has disappeared.
Overall vacancy stood at approximately 16% at the end of Q3 2026.
Colliers said vacancy was marginally lower than the level recorded in Q3 2025 but increased sequentially during Q3 because of record supply additions and churn.
At first glance, this may appear contradictory: leasing is growing, yet vacancy has moved up quarter-on-quarter.
The explanation lies in the timing mismatch between supply and absorption.
Developers added 19.2 million sq ft during Q3, while leasing stood at 18.7 million sq ft.
That does not mean every newly completed building immediately becomes occupied. Office buildings require time for leasing, fit-outs and occupier move-ins.
WHAT THE 16% VACANCY FIGURE MEANS
Strong leasing does not automatically translate into falling vacancy.
When new supply enters the market faster than space is absorbed in the immediate quarter, vacancy can temporarily rise even while underlying demand remains healthy.
Yet Rents Are Rising
One of the more notable findings is that average rentals across the top seven office markets increased 7% year-on-year during Q3 2026.
Colliers attributed the rental increase to sustained demand for superior and green-certified developments, particularly in high-activity micro-markets.
This suggests that the market is increasingly differentiating between office assets rather than treating all Grade A supply equally.
A building may face vacancy pressure at the overall market level while high-quality, well-located and preferred assets continue to command stronger rents.
For landlords, therefore, the headline vacancy number may be less important than the quality, location and specification of individual buildings.
For occupiers, the implication is equally important: rising rents in active micro-markets could increase the cost of securing premium office space even when overall vacancy remains relatively high.
Flex Could Change the Office Portfolio Equation
The growth of flex-space leasing may represent more than a temporary response to changing workplace preferences.
Flex operators accounted for 23% of leasing during the first nine months of 2026, compared with 18% a year earlier.
The quarterly increase was even sharper: flex-space leasing reached approximately 4 million sq ft in Q3, up 49% year-on-year.
Colliers also noted that the volume of large flex deals of 100,000 sq ft or more doubled in Q3 compared with the corresponding period last year.
Colliers View
“Flex spaces could potentially form 20-25% of occupiers’ real estate portfolios over the next few years, up from 15-20% currently,” said Vimal Nadar, National Director and Head of Research, Colliers India.
If that trajectory materialises, the office market could see a continued shift from companies directly leasing large conventional offices towards a combination of conventional and managed/flexible space.
That would have implications for developers, landlords and flex operators alike.
What the Numbers Mean for Developers
The data presents a mixed but potentially favourable environment for office developers.
Demand has increased 7% year-on-year, but new supply has also remained substantial.
The key issue is therefore not simply whether demand exists, but whether new supply is delivered in markets and micro-markets where occupiers are actively looking for space.
Bengaluru and Hyderabad currently demonstrate the strongest combination of demand and supply growth.
Mumbai presents a different picture: supply increased while nine-month leasing declined.
This suggests that market-level performance can differ considerably even within a broadly positive national cycle.
What It Means for Office Occupiers
For companies, the market offers more choice but not necessarily uniformly lower occupancy costs.
Overall vacancy of around 16% indicates that significant space remains available.
However, the 7% increase in average rentals shows that high-demand locations and quality assets can command stronger pricing.
The growing role of flex space also gives occupiers another option: instead of committing entirely to long-term conventional leases, companies can increasingly combine traditional offices with flexible or managed workspace.
What It Means for India’s Commercial Real Estate Market
The nine-month numbers suggest that India’s office market in 2026 is being shaped by three simultaneous forces:
1. Sustained demand:
At 54.4 million sq ft, leasing is already 7% above the corresponding period of 2025.
2. Changing occupier behaviour:
Flex-space leasing has grown 37%, far faster than conventional leasing, and now represents 23% of the nine-month leasing volume.
3. Strong developer response:
New supply reached 41.7 million sq ft during Jan-Sep, with Q3 alone accounting for 19.2 million sq ft.
These three forces are interacting rather than operating independently.
More demand encourages new supply. More supply creates greater choice but can temporarily increase vacancy. At the same time, occupiers are increasingly using flex-space formats, changing the type of office product that is in demand.
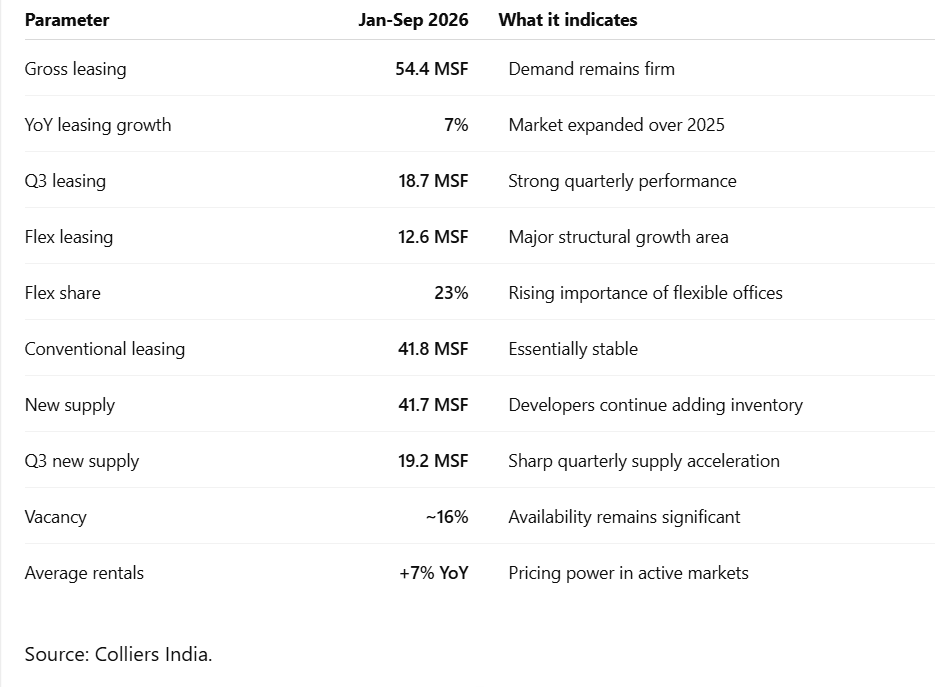
The 2026 Office Market at a Glance
The Bottom Line: Growth, But With a Changing Market Structure
The first nine months of 2026 show an Indian office market that has remained resilient, but the more interesting story is beneath the headline leasing number.
The market has added 3.5 million sq ft of leasing over the corresponding period last year. Almost all of that incremental volume has come from flex-space operators, while conventional leasing has remained virtually unchanged.
At the same time, developers have brought more than 41 million sq ft of new space to the seven major markets, with an exceptionally strong supply addition of 19.2 million sq ft in Q3.
The result is a market that is growing while simultaneously becoming more differentiated.
Bengaluru remains the largest leasing market. Hyderabad has emerged as a major growth engine. Delhi NCR has regained momentum. Mumbai remains a significant market but recorded lower nine-month leasing than last year. Meanwhile, flex space is rapidly increasing its share of occupier demand.
The next quarter will determine how much of this momentum translates into the full-year outcome. Colliers has indicated the possibility of 75-80 million sq ft of transactions in 2026, but that remains a forward-looking estimate rather than an achieved figure.
For now, the strongest conclusion supported by the data is that India’s office market is not simply recovering or expanding in volume. It is also undergoing a change in where demand is coming from, what type of space occupiers want, and how quickly developers are responding to that demand.
Also Read: Indian Real Estate: Riding Higher in 2025