

Are Smaller developers being acquired by big sharks in the market? There is a narrative being set, but the truth is far away from reality and figures speak for themselves.
By Pankaj Kapoor
The standard narrative of most talk shows, media articles, and investor presentations suggests the consolidation in the real estate market. The general perception is that the demonetization and introduction of RERA and GST compliances have made real estate a business of deep pockets. Smaller developers have been or are being acquired by the large developers. Thus there is massive consolidation in the market. However, the data from Liases Foras shows an entirely different story.
We have analyzed the consolidation theory from three angles.
- Is the real estate market witnessing a reduction in the number of developers?
- Is the contribution of revenue and sales skewed towards the Top 50, 100, 200
developers? - Are supply-side consolidation, joint ventures, and takeovers increasing the supply
magnitude of large developers, and has this increased their revenue?
Methods
Since most of the interventions mentioned above were introduced post-2015, Demonetisation in 2016, RERA, and GST came into force in 2017; thus, we decided to look at the data trends from 2015 from the perspective of the above three questions.
Liases Foras has been tracking the real estate market across 60 cities in India, monitoring active projects’ performance in primary marketable supply.
At present (as of Dec 2020), there were 11,620 developers with 17,022 active projects. The definition of marketable supply is that the developers should have unsold inventory for those projects, and he is offering them for sale in the market. Thus this consists of only primary supply and does not include resales or proposed supply.
Far from consolidation, the supplier ecosystem is broadening
| Number of Developers | Number of Developers | Number of Developers | Number of Developers | Number of Developers | Number of Developers | Number of Developers |
| Year | CY 2015 | CY 2016 | CY 2017 | CY 2018 | CY 2019 | CY 2020 |
| Developers | 7,876 | 9,042 | 10,425 | 11,569 | 12,249 | 11,620 |
Data shows a steady increase in developers’ number from 7,876 developers in 2015, growing over 50% to 12,249 by 2019. The number of builders has been increasing every year, except during CY 2020, which has reduced the number of developers with active supply mainly because of the Covid-19 impact.
Instead of consolidation, the trend suggests that the real estate market has been broad basing all these years.
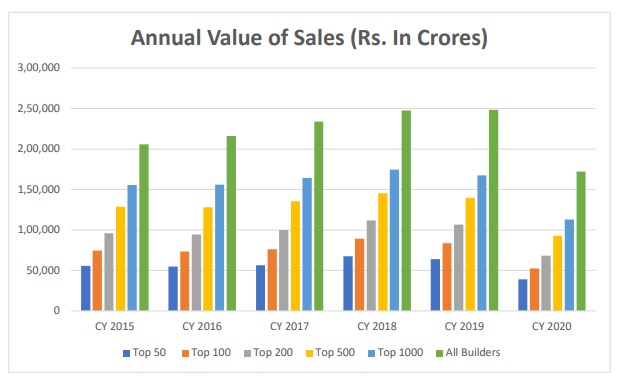
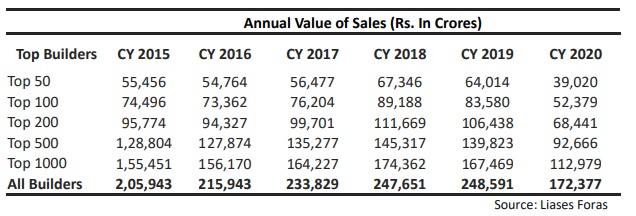
Total sales value increased, but the share of top builders fell.
The value of the stock sold also shows similar trends.
The annual value of sales contributed by all the builders show an upward trend. In contrast, the percentage share of top builders witnessed a decrease, especially from CY 2018, which offers a broad-based market when smaller developers increase market share.
From 2015 to 2019, the sales value increased by 20%, except during 2020 when the sales dropped by 31% due to the Covid 19 impact.
The share of the top 50 builders oscillated between 27% to 24% from 2015 till 2019 and then dropped to 23% during the Covid times in 2020. similarly, the top builders up to 1000 lost their market share by at least 4% since CY 2018.
Here, the top 50, 100, or 200 developers mean the aggregated revenue of the top 50, 100, or 200 developers out of the total developers in the respective years.
The growth in numbers of smaller developers was maximum except during the Pandemic.
The third perspective also stands true; the data show growth in super large and large developers.
The total number of developers has shown a growth of 48% since 2015. Smaller developers constitute approximately 80% of the total number of active developers in these cities. Interesting to see that despite higher numbers, smaller developers grew 45% since 2015.
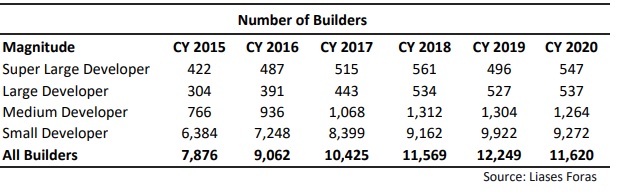
The increase in the number of super-large and large developers during pandemic times suggests amalgamation and joint ventures. But this reflects growth on the supply side that does not infer the consolidation of demand or market.
The number of super-large and large developers has increased in CY 2020. The number of medium and small developers has decreased during CY 2020, while the total number of builders also decreased.
The question that raises confusion is that when there are amalgamations, why is the number of developers not decreasing?
The answer is that joint ventures or amalgamations are happening at the project’s level and not a developer’s level. For example, a Mumbai-based developer, Nirmal Group, who had nine marketable projects, given three of his projects for the development and sales to three different developers, namely, L& T Realty, Shapoorji Pallon Ji, and Godrej Properties.
These projects have shifted from the books of Nirmal to these three developers’ books, while all four developers existed despite the amalgamation. The Nirmal group is still managing six of its projects. Most of the amalgamations are such.
Value of sales increased for small developers
When CY 2018 and CY 2019 are compared, the reduction in the value of sales within the super large developers and increase in the value of sales in smaller developers indicates that the dominance of super large developers in the market share is getting distributed to smaller developers.
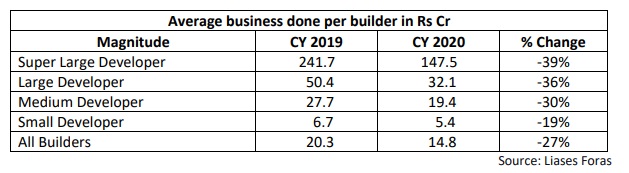
The average business done by a super large builder has seen the maximum decline of 39% during the Covid times, although the decrease of revenue of smaller developers was lowest, just 19%.
Commentary
RERA has acted as enablers and has helped the market to become broad-based. It has enabled smaller performing developers to access credit facilities from the financial institution. Our experience working with lenders also suggests similar trends. The incentives brought to boost affordable housing under PMAY have also helped smaller developers. While large developers launched mega townships, mostly far away in the peripheral locations, smaller developers offered affordable housing in interactive and end usable areas.
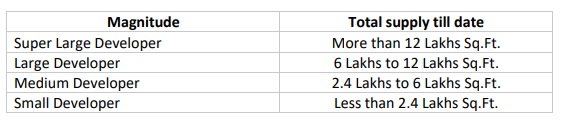
Their pricing, product mix, and location cater to local needs more efficiently. India’s real estate landscape has been expanding and broad-basing. The magnitude of developers is categorised based on the supply launched to date.
Conclusion
The housing production in tier 2 and tier 3 cities are growing much faster than in tier 1 cities. The smaller cities’ contribution to the Indian real estate landscape has been steadily increasing over the year.
Sales in Tier 1 cities grew 22% between 2015 to 2019; during the same period, sales in Tier 2 cities grew 73%, from 59,390 in 2015 to 76,466 units in 2020.
While Covid 19 has impacted the demand for tier 1 cities, it has benefited the smaller towns. Work from home/ hometown has triggered the phenomenon of spatial diffusion of jobs. The high cost of living, densities, and experience of remote working abilities coupled with cost benefits suggest that the jobs move to places where people live.
Tier 2 cities are slated to grow faster with the government’s boost for the manufacturing sector. The finance minister committed an infusion of Rs 1.97 lakh crore for the manufacturing industry. With the land cost and labor cost being cheaper in tier 2 cities, the manufacturing units are more likely to operate from smaller towns, driving smaller towns’ economic growth.
The economic growth in the smaller towns will further boost housing production and credit growth to the broader region of the Indian economy.
Rather than consolidation, the landscape of housing is expanding and will continue growing. Smaller developers of tier 2 and tier 3 cities will play a significant role in broadening housing and housing finance in India.
About The Author: Pankaj Kapoor is the Founder and MD – Liases Foras, a Real Estate Research Firm
Please Note: Views Expressed in this article solely belong to Pankaj Kapoor.
Also Read: NRI want to buy Real Estate for Self use or as Investment? Answer is here